Web App integration of LoRaWAN sensor data using open source software
In precision agriculture wireless sensor networks (WSN) are used to conveniently monitor different parameters on the field or in the greenhouse to maximize the quality and the quantity of the yield, while using less resources. One wireless standard, which gained popularity in the last years, is LoRaWAN (Low-Power Wide-Area Network), which uses lower frequencies for increased radio range (1 to 10 km) and extended batterie life (up to 10 years). Because of this, LoRaWAN is a good fit for precision agriculture. However, the software for registering the sensors and for receiving, analyzing and displaying the sensor data in a web app is mostly of proprietary origin, often in the form of a subscription model. This innovation offers a workflow for integrating LoRaWAN sensor data into a web application using open source software.

For the ADDFerti project, where A Data-Driven platform for Site-Specific Fertigation is in developement, the soil moisture content of the field needs to be constantly measured. Using commercially available batterie powered LoRa soil moisture sensors offers a good flexibility with the placement of the sensors. For data management there are also proprietary software solutions available, but for this project an workflow was developed, using open source software and custom scripts written in python.
Streaming LoRaWAN sensor data from the field into a local database and integrating the data into a custom Web-Application for monitoring and analyzing of field parameters.
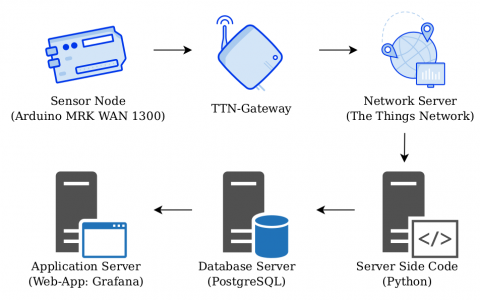
The sensors communicate via LoRaWAN with a nearby placed LoRaWAN-Gateway, which in turn is connected to the internet via an SIM-Card. The sensors and the gateway are then registered to “The Things Network”, an open-source and community based network server. There the raw data is decrypted and saved on the network server for max. 24 hours. Via an python script, which calls the open API at “The Things Networks”, the decrypted LoRa data is periodically downloaded, aggregated and saved locally in a database. For monitoring and visualization of the soil moisture data an Web App (Grafana) was installed on the server, which reads the database via sql queries and aggregates the data into charts. A link to the live view of the monitoring tool as well as the github repository with the python script can be found in the references.
The workflow was tried and tested in the laboratory and at our test field. Next step would be to develop a UI and to parameterize the python script for accessing the API of the network server.
